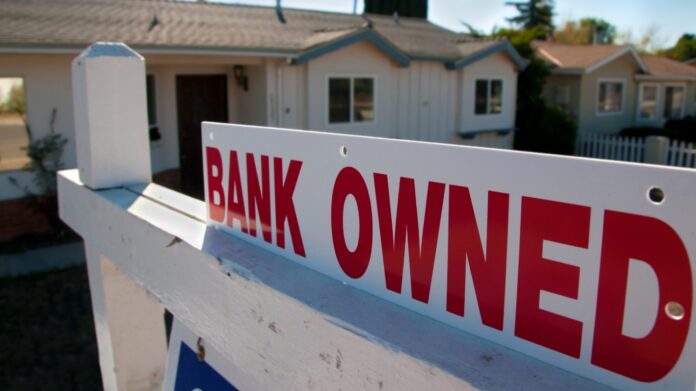
 Demand for single-family homes surged in the past two years, as the coronavirus pandemic prompted people to look for more living space. The increased demand, facilitated by low interest rates and coupled with supply constraints, led to soaring home prices. (These are 15 cities with the most overpriced housing markets.)
But now the U.S. housing market appears to be coming back to earth, with some parts of the country showing early distress signs. Foreclosure filings — a measure of the health of housing markets at local, state, or national levels — are on the rise across the country.
According to Attom, a curator of land and property data, home foreclosure filings – which include default notices, bank repossessions, and scheduled auctions – are up 153% in the first half of 2022 compared to the same period last year.
In Minnesota, foreclosures rose by 268.5%, from 577 in the first six months of 2021 to 2,126 in the first half of 2022. The foreclosure rate in the state of one in every 1,169 homes ranks as the 24th lowest in the nation.
According to five-year estimates from the U.S. Census Bureau’s 2020 American Community Survey, 66.0% of homeowners in Minnesota are paying down a mortgage, the 13th largest share among states.
The typical household in the state has an income of $73,382 a year, and the typical home is worth $235,700. For context, the typical American household’s annual income is $64,994, and the national median home value is $229,800.
| Rank | State | Foreclosure rate (foreclosures per housing unit) | Homes in foreclosure, 1st half 2022 | Homes with a mortgage (%) | Median home value ($) |
|---|---|---|---|---|---|
| 1 | Illinois | 1:385 | 14,086 | 62.8 | 202,100 |
| 2 | New Jersey | 1:410 | 9,177 | 66.0 | 343,500 |
| 3 | Ohio | 1:475 | 11,028 | 62.4 | 151,400 |
| 4 | Delaware | 1:497 | 903 | 64.7 | 258,300 |
| 5 | South Carolina | 1:513 | 4,568 | 57.7 | 170,100 |
| 6 | Florida | 1:560 | 17,624 | 56.7 | 232,000 |
| 7 | Nevada | 1:567 | 2,259 | 67.5 | 290,200 |
| 8 | Indiana | 1:606 | 4,822 | 65.2 | 148,900 |
| 9 | Georgia | 1:770 | 5,731 | 64.5 | 190,200 |
| 10 | Michigan | 1:773 | 5,913 | 59.6 | 162,600 |
| 11 | Connecticut | 1:773 | 1,979 | 67.4 | 279,700 |
| 12 | Oklahoma | 1:824 | 2,120 | 54.5 | 142,400 |
| 13 | Maryland | 1:863 | 2,934 | 72.5 | 325,400 |
| 14 | California | 1:881 | 16,340 | 69.5 | 538,500 |
| 15 | Iowa | 1:899 | 1,571 | 60.4 | 153,900 |
| 16 | Alabama | 1:925 | 2,475 | 55.7 | 149,600 |
| 17 | North Carolina | 1:958 | 4,917 | 62.5 | 182,100 |
| 18 | Arizona | 1:961 | 3,207 | 63.3 | 242,000 |
| 19 | Texas | 1:1,005 | 11,527 | 56.8 | 187,200 |
| 20 | Pennsylvania | 1:1,038 | 5,531 | 59.9 | 187,500 |
| 21 | Maine | 1:1,050 | 704 | 60.7 | 198,000 |
| 22 | Colorado | 1:1,073 | 2,322 | 70.8 | 369,900 |
| 23 | Missouri | 1:1,073 | 2,596 | 61.2 | 163,600 |
| 24 | New York | 1:1,106 | 7,673 | 59.9 | 325,000 |
| 25 | Louisiana | 1:1,107 | 1,873 | 52.0 | 168,100 |
| 26 | Utah | 1:1,127 | 1,022 | 70.1 | 305,400 |
| 27 | Minnesota | 1:1,169 | 2,126 | 66.0 | 235,700 |
| 28 | Virginia | 1:1,212 | 2,985 | 68.2 | 282,800 |
| 29 | New Mexico | 1:1,225 | 768 | 53.4 | 175,700 |
| 30 | Wyoming | 1:1,394 | 195 | 58.1 | 228,000 |
| 31 | Mississippi | 1:1,397 | 945 | 50.0 | 125,500 |
| 32 | Hawaii | 1:1,431 | 392 | 64.4 | 636,400 |
| 33 | Nebraska | 1:1,443 | 585 | 59.4 | 164,000 |
| 34 | Wisconsin | 1:1,503 | 1,815 | 63.3 | 189,200 |
| 35 | Tennessee | 1:1,528 | 1,984 | 59.0 | 177,600 |
| 36 | Massachusetts | 1:1,535 | 1,954 | 68.5 | 398,800 |
| 37 | Rhode Island | 1:1,560 | 310 | 67.9 | 276,600 |
| 38 | New Hampshire | 1:1,593 | 401 | 65.0 | 272,300 |
| 39 | Arkansas | 1:1,715 | 796 | 54.2 | 133,600 |
| 40 | Alaska | 1:1,985 | 160 | 61.9 | 275,600 |
| 41 | Washington | 1:2,400 | 1,334 | 68.2 | 366,800 |
| 42 | Kentucky | 1:2,432 | 820 | 57.2 | 147,100 |
| 43 | Idaho | 1:2,473 | 304 | 64.1 | 235,600 |
| 44 | Montana | 1:2,654 | 194 | 56.0 | 244,900 |
| 45 | Oregon | 1:2,782 | 652 | 66.1 | 336,700 |
| 46 | Kansas | 1:2,810 | 454 | 58.6 | 157,600 |
| 47 | West Virginia | 1:3,626 | 236 | 46.7 | 123,200 |
| 48 | North Dakota | 1:4,466 | 83 | 53.2 | 199,900 |
| 49 | Vermont | 1:7,598 | 44 | 62.4 | 230,900 |
| 50 | South Dakota | 1:9,068 | 43 | 55.0 | 174,600 |


