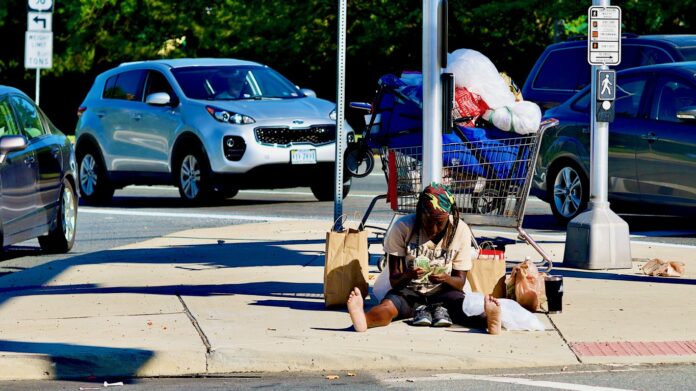
 An estimated 582,462 people experienced homelessness on a single night in January 2022, according to the Department of Housing and Urban Development. The agency notes that the economic impact of the COVID-19 pandemic could have led to a far higher number, but with government outreach and programs to prevent eviction through rental assistance, the national homelessness rate rose only by 0.3% from 2020 to 2022.
The number of unhoused people declined by 8.6%, or 54,615, since 2010, but more persons experience unsheltered homelessness. Two out of every five people without a home were living in an unsheltered setting, with the number of unsheltered homeless persons increasing by 3.4% from 2020 to 233,832 in 2022. As HUD points out, the rise in unsheltered homelessness outpaced the decrease in sheltered homeless persons.
A reported 7,917 people were experiencing homelessness in Minnesota in January 2022, and an estimated 22.3% of them were unsheltered, the 25th largest share among the 50 states.
The number of people experiencing homelessness in Minnesota has declined by 0.3% since 2020, but is up by 0.6% since 2010.
All data in this story is from the Office of Policy Development and Research.
| Rank | State | Homeless individuals w/o shelter, 2022 (%) | Total homeless population, 2022 | Change in homelessness, 2020-2022 (%) | Change in homelessness, 2010-2022 (%) |
|---|---|---|---|---|---|
| 1 | California | 67.3 | 171,521 | 6.2 | 38.9 |
| 2 | Mississippi | 63.6 | 1,196 | 8.0 | -56.4 |
| 3 | Hawaii | 62.7 | 5,967 | -7.6 | 2.3 |
| 4 | Oregon | 61.7 | 17,959 | 22.5 | -7.9 |
| 5 | Arizona | 59.2 | 13,553 | 23.4 | -1.2 |
| 6 | Tennessee | 58.0 | 10,567 | 45.6 | 2.8 |
| 7 | Arkansas | 52.7 | 2,459 | 3.9 | -11.0 |
| 8 | Georgia | 51.8 | 10,689 | 4.4 | -46.1 |
| 9 | Washington | 50.2 | 25,211 | 10.0 | 10.2 |
| 10 | Nevada | 46.8 | 7,618 | 10.4 | -32.0 |
| 11 | Florida | 45.2 | 25,959 | -5.6 | -54.9 |
| 12 | Texas | 44.9 | 24,432 | -10.3 | -30.4 |
| 13 | Idaho | 44.4 | 1,998 | -13.7 | -14.8 |
| 14 | Alabama | 42.1 | 3,752 | 12.0 | -37.9 |
| 15 | North Carolina | 38.6 | 9,382 | 1.1 | -23.0 |
| 16 | Oklahoma | 35.1 | 3,754 | -4.5 | -28.2 |
| 17 | South Carolina | 34.2 | 3,608 | -15.8 | -19.3 |
| 18 | Colorado | 30.4 | 10,397 | 5.6 | -32.8 |
| 19 | Kansas | 29.1 | 2,397 | -2.1 | 18.4 |
| 20 | West Virginia | 29.0 | 1,375 | 2.5 | -39.3 |
| 21 | Kentucky | 27.2 | 3,984 | -0.7 | -39.8 |
| 22 | Missouri | 26.7 | 5,992 | -8.2 | -26.2 |
| 23 | South Dakota | 24.6 | 1,389 | 31.3 | 90.0 |
| 24 | Utah | 24.5 | 3,557 | 13.6 | 8.3 |
| 25 | Minnesota | 22.3 | 7,917 | -0.3 | 0.6 |
| 26 | New Mexico | 21.6 | 2,560 | -23.2 | -26.3 |
| 27 | New Hampshire | 20.6 | 1,605 | -4.2 | 2.0 |
| 28 | Illinois | 20.6 | 9,212 | -11.7 | -36.0 |
| 29 | Montana | 18.5 | 1,585 | 2.6 | -1.9 |
| 30 | Ohio | 18.3 | 10,654 | 0.0 | -15.2 |
| 31 | Louisiana | 16.8 | 7,373 | 132.4 | -40.9 |
| 32 | Iowa | 16.8 | 2,419 | -8.6 | -19.7 |
| 33 | Maryland | 16.7 | 5,349 | -15.9 | -50.7 |
| 34 | Rhode Island | 15.7 | 1,577 | 42.8 | 23.0 |
| 35 | Alaska | 15.4 | 2,320 | 19.0 | 24.5 |
| 36 | Indiana | 14.7 | 5,449 | -3.1 | -15.5 |
| 37 | North Dakota | 13.6 | 610 | 12.8 | -23.7 |
| 38 | Pennsylvania | 12.7 | 12,691 | -5.1 | -12.6 |
| 39 | New Jersey | 11.2 | 8,752 | -9.4 | -36.3 |
| 40 | Michigan | 11.0 | 8,206 | -5.0 | -37.2 |
| 41 | Virginia | 10.5 | 6,529 | 9.6 | -28.1 |
| 42 | Connecticut | 10.0 | 2,930 | 0.9 | -32.1 |
| 43 | Wyoming | 9.9 | 648 | 5.9 | 11.9 |
| 44 | Nebraska | 9.6 | 2,246 | -6.6 | -42.1 |
| 45 | Massachusetts | 7.3 | 15,507 | -13.7 | -6.8 |
| 46 | Delaware | 6.5 | 2,369 | 103.3 | 141.2 |
| 47 | Wisconsin | 6.3 | 4,775 | 5.8 | -24.6 |
| 48 | New York | 5.4 | 74,178 | -18.7 | 13.1 |
| 49 | Maine | 3.7 | 4,411 | 110.3 | 85.4 |
| 50 | Vermont | 1.6 | 2,780 | 150.5 | 127.9 |


