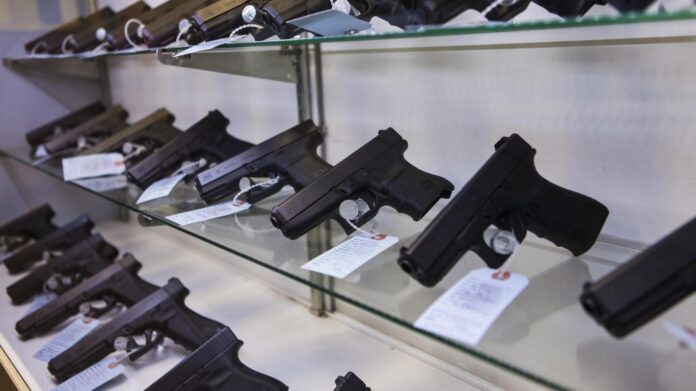
 Homicides surged in the U.S. by nearly 30% in 2020, the largest annual increase since record keeping began. The same year, U.S. firearm sales hit an all-time high of nearly 23 million, increasing 24% from 2019, according to consulting firm Small Arms Analytics.
The increase in gun sales at the same time that murders spiked may be more than mere coincidence. Based on local police department data compiled by the FBI, an estimated 77% of murders were committed with a firearm in 2020. Firearm homicide numbers vary considerably by state, however.
In Minnesota, a total of 189 murders committed in 2020 had a weapon associated it. Of those murders with a known weapon type, 75.1% involved a firearm, the 18th most of the 45 states with available data.
Nationwide, handguns are by far the most commonly used firearm type in murder cases, and in Minnesota, handguns were used in 79 of the 142 murder cases involving firearms.
According to the FBI’s Uniform Crime Reporting Program, the overall murder rate in Minnesota stands at 3.4 for every 100,000 people, compared to the national homicide rate of 6.5 per 100,000.
| Rank | State | Share of homicides involving a gun, 2020 (%) | Total murders involving a gun, 2020 | Total murders involving a handgun, 2020 |
|---|---|---|---|---|
| 1 | Delaware | 89.2 | 66 | 32 |
| 2 | Illinois | 86.7 | 896 | 762 |
| 3 | Wyoming | 85.7 | 12 | 10 |
| 4 | Tennessee | 85.4 | 566 | 234 |
| 5 | Louisiana | 85.1 | 593 | 242 |
| 6 | South Carolina | 84.5 | 453 | 240 |
| 7 | Kentucky | 84.5 | 261 | 155 |
| 8 | Missouri | 82.9 | 470 | 265 |
| 9 | Maryland | 81.6 | 400 | 354 |
| 10 | Virginia | 80.7 | 423 | 212 |
| 11 | Michigan | 79.2 | 595 | 237 |
| 12 | Indiana | 78.5 | 366 | 246 |
| 13 | North Carolina | 78.2 | 580 | 325 |
| 14 | Texas | 77.4 | 1491 | 751 |
| 15 | Ohio | 76.8 | 600 | 269 |
| 16 | Arkansas | 76.3 | 235 | 104 |
| 17 | Iowa | 75.7 | 84 | 33 |
| 18 | Minnesota | 75.1 | 142 | 79 |
| 19 | Rhode Island | 75.0 | 24 | 4 |
| 20 | Wisconsin | 74.9 | 227 | 85 |
| 21 | Massachusetts | 73.1 | 117 | 64 |
| 22 | California | 72.9 | 1606 | 1032 |
| 23 | Utah | 72.8 | 67 | 43 |
| 24 | Kansas | 70.8 | 63 | 31 |
| 25 | Oregon | 70.5 | 86 | 43 |
| 26 | Connecticut | 70.0 | 98 | 23 |
| 27 | New Jersey | 69.6 | 229 | 156 |
| 28 | Colorado | 68.9 | 202 | 141 |
| 29 | Arizona | 68.7 | 292 | 219 |
| 30 | Maine | 68.2 | 15 | 10 |
| 31 | West Virginia | 67.6 | 69 | 38 |
| 32 | Oklahoma | 67.5 | 197 | 140 |
| 33 | Nebraska | 66.1 | 41 | 31 |
| 34 | New York | 64.7 | 517 | 415 |
| 35 | Vermont | 64.3 | 9 | 6 |
| 36 | Idaho | 64.1 | 25 | 18 |
| 37 | New Mexico | 63.3 | 88 | 29 |
| 38 | Nevada | 62.2 | 107 | 77 |
| 39 | Washington | 59.4 | 177 | 102 |
| 40 | New Hampshire | 50.0 | 6 | 3 |
| 41 | Montana | 49.1 | 28 | 16 |
| 42 | Alaska | 45.8 | 22 | 16 |
| 43 | North Dakota | 45.2 | 14 | 5 |
| 44 | Hawaii | 41.0 | 16 | 5 |
| 45 | South Dakota | 40.8 | 20 | 13 |


