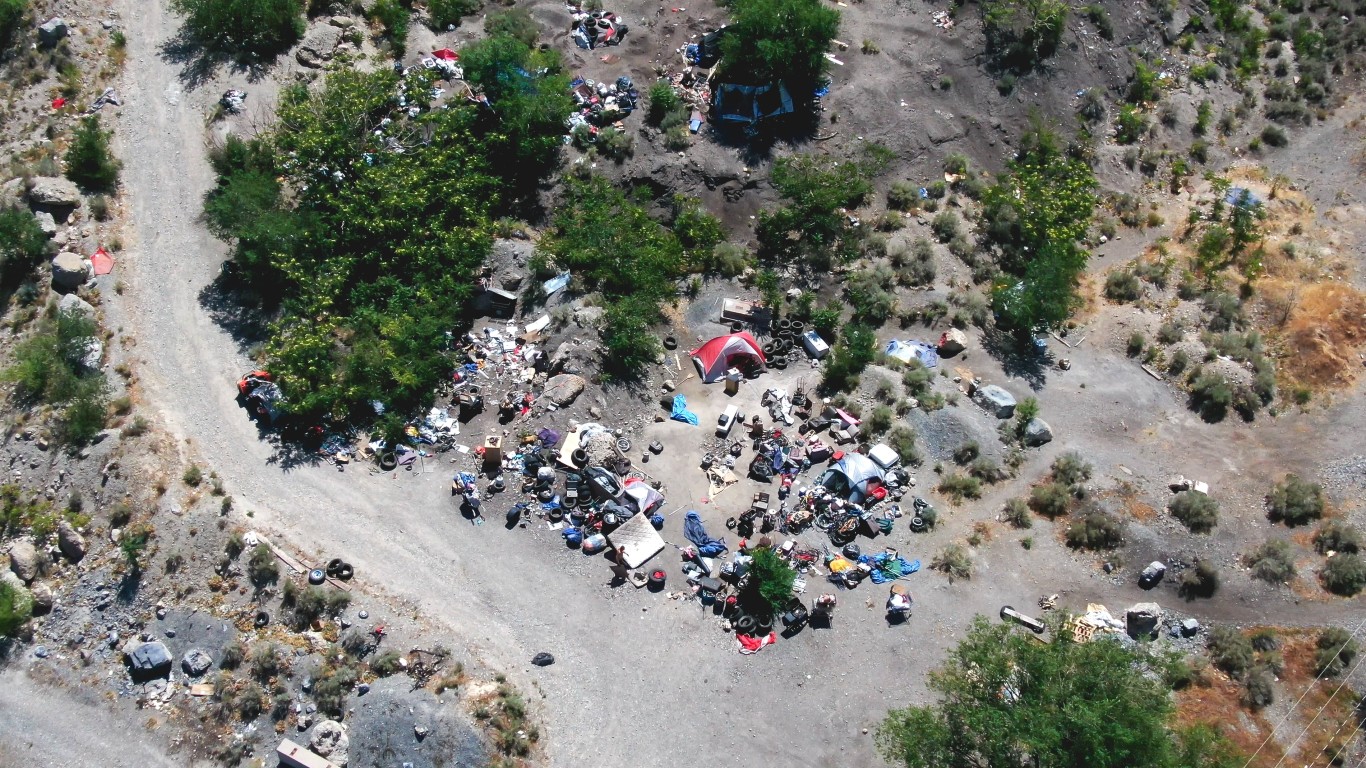
 On a single night in 2022, 582,462 people experienced homelessness in the United States, and numbers are on the rise. Since 2017, there has been a 6% increase in homelessness.
About six in 10 of the people experiencing homelessness in 2022 had access to emergency shelters, transitional housing programs, or safe havens, while the remainder were unsheltered. Rates of unsheltered homelessness — which includes those sleeping on the streets, in abandoned buildings, and in wooded areas — are also on the rise.
According to the U.S. Department of Housing and Urban Development, there were an estimated 7,917 people experiencing homelessness on a single night in Minnesota in 2022. Adjusting for population, this comes out to about 13.9 people for every 10,000 state residents, the 19th most among the 50 states.
Of those experiencing homelessness in Minnesota, a reported 22.3% were unsheltered, the 20th lowest share among states.
All data in this story is from the 2022 Annual Homelessness Assessment Report to Congress from the U.S. Department of Housing and Urban Development.
| Rank | State | Homeless population per 10,000 state residents, 2022 | Total residents experiencing homelessness, 2022 | Homeless population without shelter, 2022 (%) |
|---|---|---|---|---|
| 1 | California | 43.7 | 171,521 | 67.3 |
| 2 | Vermont | 43.1 | 2,780 | 98.4 |
| 3 | Oregon | 42.3 | 17,959 | 61.7 |
| 4 | Hawaii | 41.4 | 5,967 | 62.7 |
| 5 | New York | 37.4 | 74,178 | 5.4 |
| 6 | Washington | 32.6 | 25,211 | 50.2 |
| 7 | Maine | 32.1 | 4,411 | 3.7 |
| 8 | Alaska | 31.7 | 2,320 | 15.4 |
| 9 | Nevada | 24.2 | 7,618 | 46.8 |
| 10 | Delaware | 23.6 | 2,369 | 6.5 |
| 11 | Massachusetts | 22.2 | 15,507 | 7.3 |
| 12 | Arizona | 18.6 | 13,553 | 40.8 |
| 13 | Colorado | 17.9 | 10,397 | 69.6 |
| 14 | Louisiana | 15.9 | 7,373 | 16.8 |
| 15 | South Dakota | 15.5 | 1,389 | 24.6 |
| 16 | Tennessee | 15.1 | 10,567 | 58 |
| 17 | Montana | 14.4 | 1,585 | 18.5 |
| 18 | Rhode Island | 14.4 | 1,577 | 15.7 |
| 19 | Minnesota | 13.9 | 7,917 | 22.3 |
| 20 | New Mexico | 12.1 | 2,560 | 21.6 |
| 21 | Florida | 11.9 | 25,959 | 45.2 |
| 22 | New Hampshire | 11.6 | 1,605 | 20.6 |
| 23 | Nebraska | 11.4 | 2,246 | 9.6 |
| 24 | Wyoming | 11.2 | 648 | 90.1 |
| 25 | Utah | 10.7 | 3,557 | 24.5 |
| 26 | Idaho | 10.5 | 1,998 | 44.4 |
| 27 | Georgia | 9.9 | 10,689 | 48.2 |
| 28 | Pennsylvania | 9.8 | 12,691 | 12.7 |
| 29 | Missouri | 9.7 | 5,992 | 73.3 |
| 30 | New Jersey | 9.4 | 8,752 | 88.8 |
| 31 | Oklahoma | 9.4 | 3,754 | 35.1 |
| 32 | Ohio | 9.0 | 10,654 | 81.7 |
| 33 | North Carolina | 8.9 | 9,382 | 38.6 |
| 34 | Kentucky | 8.8 | 3,984 | 27.2 |
| 35 | Maryland | 8.7 | 5,349 | 83.3 |
| 36 | Texas | 8.3 | 24,432 | 44.9 |
| 37 | Kansas | 8.2 | 2,397 | 29.1 |
| 38 | Michigan | 8.2 | 8,206 | 11 |
| 39 | Arkansas | 8.1 | 2,459 | 52.7 |
| 40 | Connecticut | 8.1 | 2,930 | 10 |
| 41 | Wisconsin | 8.1 | 4,775 | 6.3 |
| 42 | Indiana | 8.0 | 5,449 | 14.7 |
| 43 | North Dakota | 7.9 | 610 | 13.6 |
| 44 | West Virginia | 7.7 | 1,375 | 29 |
| 45 | Iowa | 7.6 | 2,419 | 83.2 |
| 46 | Virginia | 7.6 | 6,529 | 10.5 |
| 47 | Alabama | 7.4 | 3,752 | 42.1 |
| 48 | Illinois | 7.3 | 9,212 | 20.6 |
| 49 | South Carolina | 7.0 | 3,608 | 65.8 |
| 50 | Mississippi | 4.1 | 1,196 | 63.6 |


