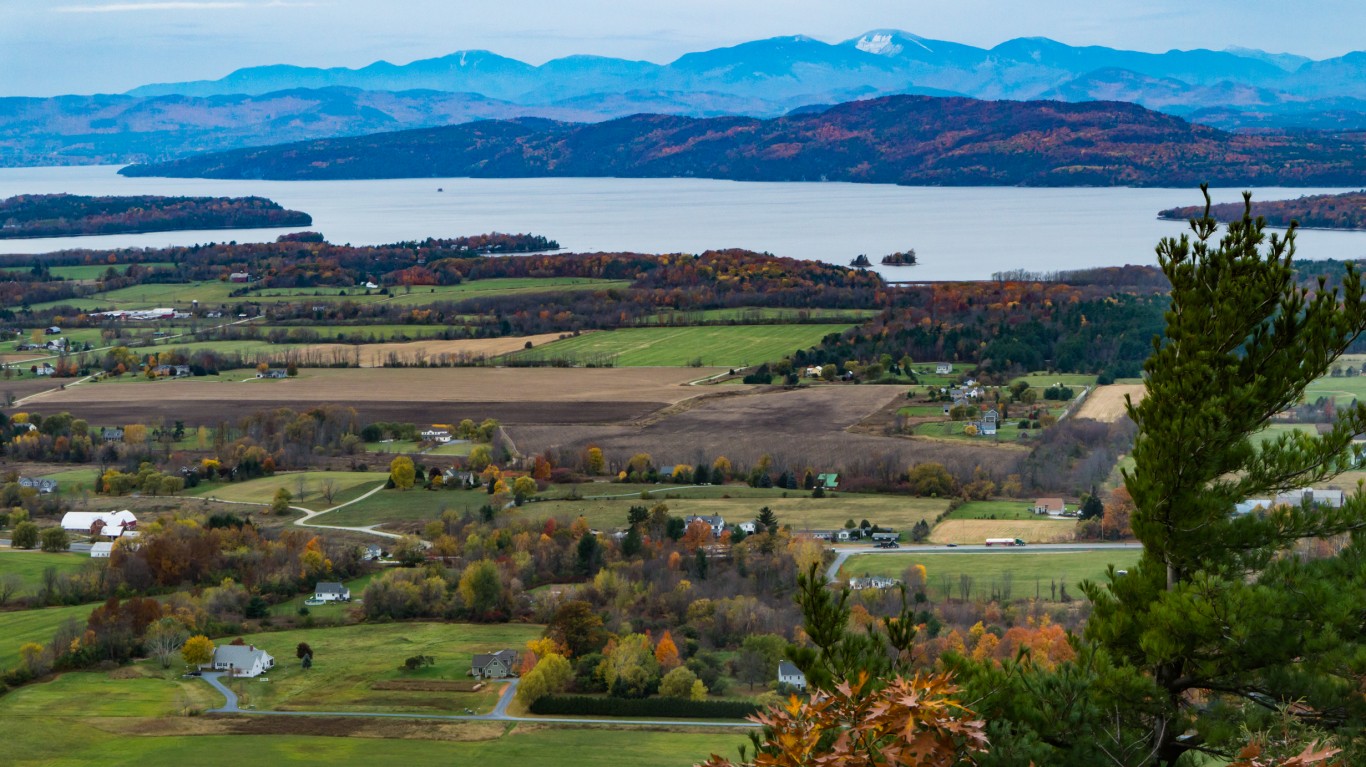
 Spanning nearly 3.8 million square miles, the United States is one of the largest countries in the world by total landmass. From the Smokey Mountains to the Rocky Mountains and the Great Plains to the Great Lakes, it is also one of the most geographically diverse.
Not all states in the Lower 48 are equally endowed with that diversity, however. Some are defined largely by their geographic uniformity, while others have a wide range of varying landscapes, including mountains, deserts, farmland, forests, lakes, and cities. (If you like mountains, this is the highest point in every state.)
Based on a land diversity index, created using data from the U.S. Geological Survey, Minnesota ranks as having the 22nd most diverse landscape of the Lower 48 states, with a 64.2% likelihood that two randomly selected parcels would have a different land cover type.
Of Minnesota’s total surface area of 86,936 square miles, agricultural and developed vegetation is the most common type of land cover, accounting for 43.9% of the state’s area.
| Landscape diversity rank | State | Odds two random land parcels have a different use (%) | Total land area (sq. mi.) |
|---|---|---|---|
| 1 | Texas | 80.2 | 268,596 |
| 2 | Montana | 78.5 | 147,040 |
| 3 | California | 77.9 | 163,695 |
| 4 | Washington | 77.1 | 71,298 |
| 5 | Delaware | 76.6 | 2,489 |
| 6 | Colorado | 76.6 | 104,094 |
| 7 | Louisiana | 76.2 | 52,378 |
| 8 | Maryland | 75.6 | 12,406 |
| 9 | Florida | 74.3 | 65,758 |
| 10 | New Jersey | 73.2 | 8,723 |
| 11 | Idaho | 72.7 | 83,569 |
| 12 | Oregon | 71.2 | 98,379 |
| 13 | North Carolina | 70.0 | 53,819 |
| 14 | Utah | 69.8 | 84,897 |
| 15 | Rhode Island | 69.5 | 1,545 |
| 16 | Oklahoma | 69.5 | 69,899 |
| 17 | Michigan | 68.2 | 96,714 |
| 18 | New Mexico | 68.2 | 121,590 |
| 19 | Wisconsin | 67.9 | 65,496 |
| 20 | Ohio | 66.4 | 44,826 |
| 21 | Massachusetts | 66.3 | 10,554 |
| 22 | Minnesota | 64.2 | 86,936 |
| 23 | South Carolina | 63.9 | 32,020 |
| 24 | New York | 63.6 | 54,555 |
| 25 | Tennessee | 63.2 | 42,144 |
| 26 | Virginia | 63.0 | 42,775 |
| 27 | Wyoming | 62.5 | 97,813 |
| 28 | South Dakota | 62.4 | 77,116 |
| 29 | Connecticut | 61.3 | 5,543 |
| 30 | Kentucky | 61.1 | 40,408 |
| 31 | Georgia | 60.8 | 59,425 |
| 32 | Mississippi | 60.7 | 48,432 |
| 33 | Arkansas | 58.6 | 53,179 |
| 34 | Nebraska | 57.9 | 77,348 |
| 35 | Missouri | 57.7 | 69,707 |
| 36 | Pennsylvania | 57.7 | 46,054 |
| 37 | Alabama | 57.6 | 52,420 |
| 38 | Indiana | 54.3 | 36,420 |
| 39 | Kansas | 53.5 | 82,278 |
| 40 | Arizona | 53.4 | 113,990 |
| 41 | North Dakota | 53.4 | 70,698 |
| 42 | Illinois | 51.1 | 57,914 |
| 43 | Nevada | 43.7 | 110,572 |
| 44 | Vermont | 42.6 | 9,616 |
| 45 | Maine | 39.5 | 35,380 |
| 46 | New Hampshire | 34.5 | 9,349 |
| 47 | West Virginia | 34.4 | 24,230 |
| 48 | Iowa | 33.5 | 56,273 |


